Quant Analyzer Report
StrategyTester_eurusd_total_09_22
Source: MT4Report| Symbol | EURUSD | Period | M15 : 05.01.2009 - 31.03.2022 |
|---|---|---|---|
| Initial deposit | 10000.0 | ||
| Parameters | - | ||
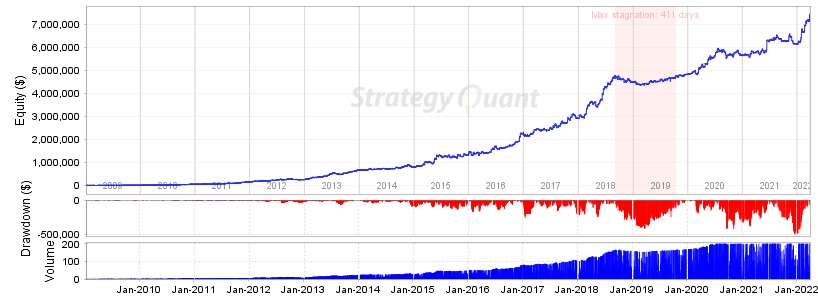
Total Profit
$ 7250536.17
Profit in pips
36456.4 pips
Yrly Avg profit
$ 547170.51
Yrly Avg % ret
5471.7 %
CAGR
60.09 %
# of trades
6467
Sharpe ratio
0.13
Profit factor
1.38
Return / DD ratio
14.66
Winning %
57.99 %
Drawdown
$ 494479.37
% Drawdown
20.88 %
Daily Avg profit
$ 2640.4
Mthly Avg profit
$ 45600.86
Average trade
$ 7015.95
Annual% / Max DD%
2.88
R Expectancy
0.16 R
R Exp score
78 R
SQN
5.98
SQN score
5.62
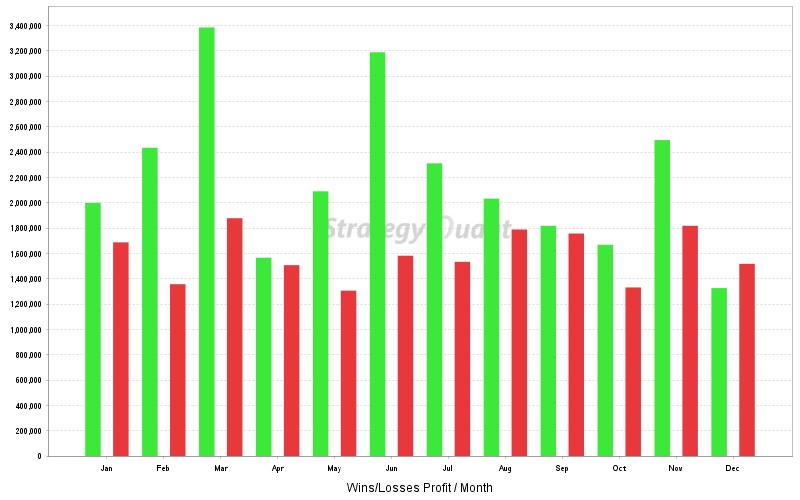
Monthly Performance ($)
| Year | Jan | Feb | Mar | Apr | May | Jun | Jul | Aug | Sep | Oct | Nov | Dec | YTD |
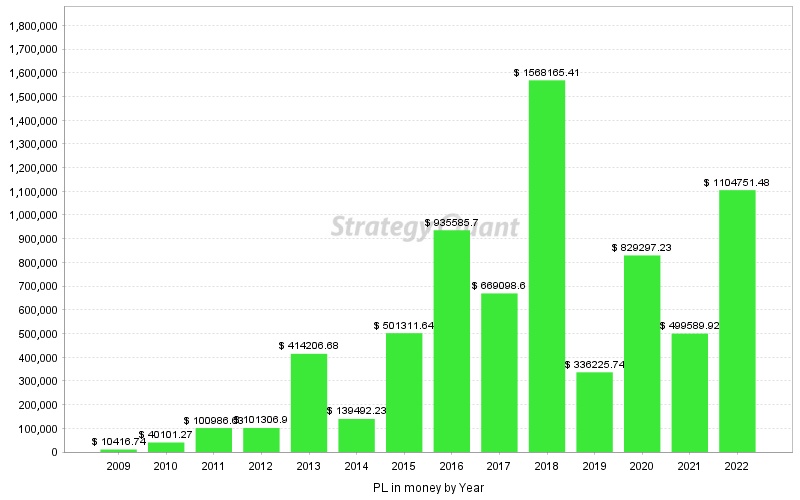
| 2022 | 254934.76 | 528025.12 | 321791.6 | 0 | 0 | 0 | 0 | 0 | 0 | 0 | 0 | 0 | 1104751.48 |
| 2021 | 13778.51 | 42330.51 | 59523.1 | -59483.04 | 63211.6 | 505730.45 | 118248.33 | 5264.39 | -123251.59 | 14889.02 | -1901.34 | -138750.02 | 499589.92 |
| 2020 | 46328.48 | -12204.99 | 250329.93 | 161720.98 | 290970.97 | 21597.12 | 229438.56 | 25993.97 | -179831.87 | -54950.6 | 232141.29 | -182236.61 | 829297.23 |
| 2019 | -92228.59 | -17802.99 | 47986 | 85686.42 | 14168.18 | -10835.48 | 150032.43 | -15192.72 | -5065.5 | 61632.8 | 36251.85 | 81593.34 | 336225.74 |
| 2018 | 35327.44 | 260141.79 | 414840.17 | 3834.1 | 66961.37 | 568407.67 | 139983.04 | 285539.56 | 48388.63 | -118114.4 | -5608.09 | -131535.87 | 1568165.41 |
| 2017 | -56414.25 | 50339.94 | 202309.11 | -74307.27 | 54701.78 | 78264.71 | 129602.96 | -50948.51 | 133959.61 | 212953.5 | 193039.38 | -204402.36 | 669098.6 |
| 2016 | -134.83 | 117330.09 | 43573.83 | -49860.21 | 28848.27 | 206710.73 | -24774.62 | -3432.36 | 80662.35 | 62985.26 | 139304.34 | 334372.85 | 935585.7 |
| 2015 | 40826.54 | 19568.95 | 148009.33 | -52977.55 | 184484.66 | 139317.81 | -37273.59 | 25496.46 | -11847.66 | 25878.52 | -27534.3 | 47362.47 | 501311.64 |
| 2014 | 4738.99 | 6348.03 | 6208.39 | 17815.27 | 14134.34 | -3510.52 | 4692.98 | 16087.57 | 24446.73 | 75482.93 | 51188.86 | -78141.34 | 139492.23 |
| 2013 | 35792.09 | 65489.82 | 3250.87 | 25041.63 | 28805.27 | 82789.85 | 19352.33 | -35888.95 | 47333.69 | 55370.35 | 27665.58 | 59204.15 | 414206.68 |
| 2012 | 25591.87 | 8404.77 | 9876.28 | -5567.05 | 34662.29 | 5927.49 | 37878.64 | -16873.32 | 21311.32 | -15676.45 | -8811.9 | 4582.96 | 101306.9 |
| 2011 | 1033.36 | 7779.63 | -859.84 | 3299.24 | 2707.34 | 8395.87 | 5158.38 | 8070.95 | 11813.25 | 12748.39 | 26184.24 | 14655.82 | 100986.63 |
| 2010 | 1496.17 | 1149.16 | 177.73 | 2219.11 | -22.85 | 2223.71 | 6952.49 | -2542.08 | 11948.53 | 775.7 | 17213.5 | -1489.9 | 40101.27 |
| 2009 | 691.52 | 777.53 | -366.91 | 1658.13 | 665.29 | 1587.23 | -1957.06 | 2247.19 | 1378.2 | 2919.52 | -2396.38 | 3212.48 | 10416.74 |
Stats
Strategy
| Wins/Losses Ratio | 1.38 | Payout Ratio (Avg Win/Loss) | 1 | Average # of Bars in Trade | 0 |
| AHPR | 0.11 | Z-Score | -14.77 | Z-Probability | 99.9 % |
| Expectancy | 1121.16 | Deviation | $ 16184.33 | Exposure | -999999999 % |
| Stagnation in Days | 411 | Stagnation in % | 8.5 % |
Trades
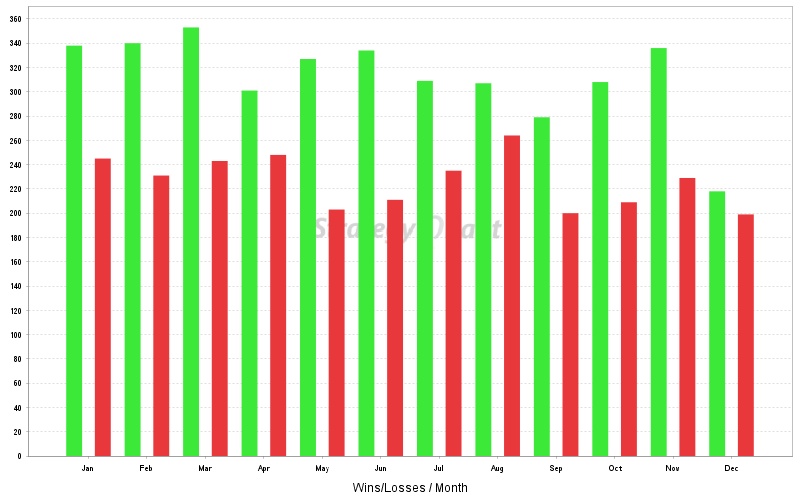
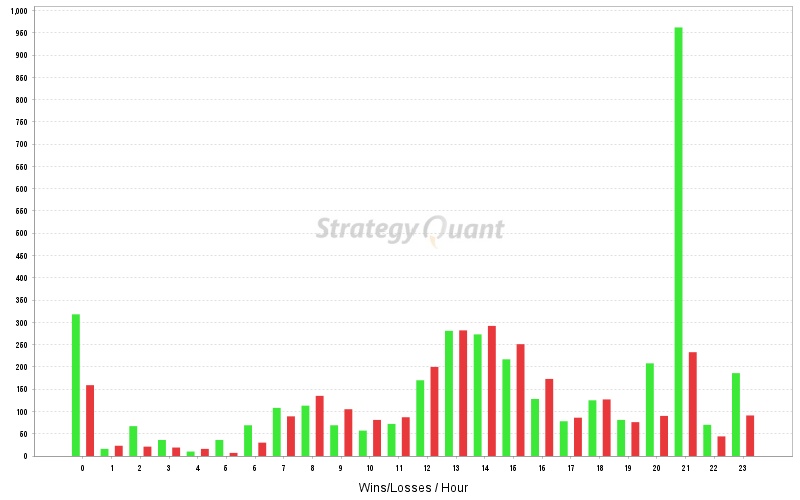
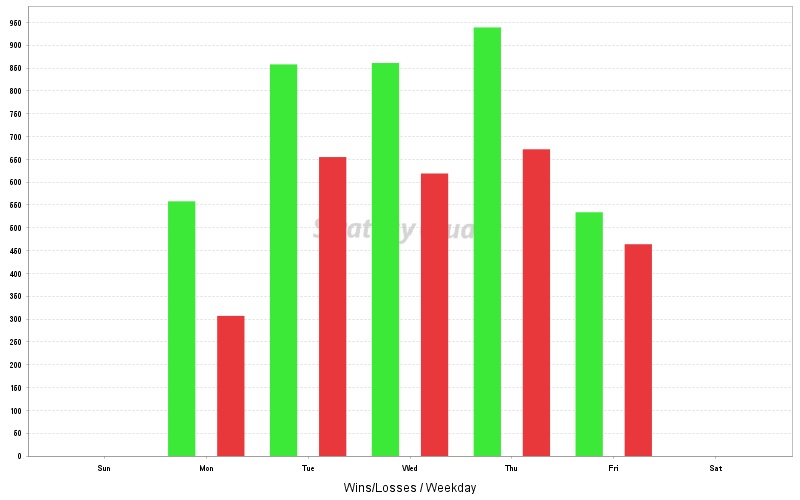
| # of Wins | 3750 | # of Losses | 2717 | # of Cancelled/Expired | 0 | ||
| Gross Profit | $ 26311338.24 | Gross Loss | $ -19060802.07 | Average Win | $ 7016.36 | Average Loss | $ -7015.39 |
| Largest Win | $ 158199.54 | Largest Loss | $ -161320 | Max Consec Wins | 18 | Max Consec Losses | 12 |
| Avg Consec Wins | 2.91 | Avg Consec Loss | 2.11 | Avg # of Bars in Wins | 0 | Avg # of Bars in Losses | 0 |
Charts
Click on the chart to see bigger image
